A train moves with a speed of 30 km/h in the first 15 minutes, with another speed of 40 km/h in the next 15 minutes and then with a speed of 60 km/h in the last 30 minutes. Calculate the average speed of the train for this journey.
Distance covered by the train in the first 15 minutes is 
When do you say a body is in
(i) uniform acceleration, and
(ii) variable acceleration?
(i) Uniform acceleration:
When an object travels in a straight line and its velocity changes by equal amounts in equal intervals of time, the object is said to be in ‘uniform acceleration’.
For example, a body falling freely to the ground has a uniform acceleration of 9.8 m/s2 as its velocity increases by 9.8 m/s after every one second.
(ii) Variable acceleration:
When the velocity of an object changes by unequal amounts in equal intervals of time, the object is said to have ‘variable acceleration’.
For example, if the speed of a car travelling along a straight road increases by unequal amounts, then the car is moving with non-uniform acceleration.
What are the uses of graphical study of motion?
Graphical representation of motion is useful to study the nature of motion of bodies. In this type of representation, time is plotted along X-axis while distance or velocity is plotted along Y-axis.
Graphs give more detailed information about the nature of motion than when motion is expressed in a tabular form.
The uses of graphical representaion of motion are:
(i) From distance-time graph the position of the body at any instant of time can be determined.
(ii) Distance covered by the body during particular interval of time can be seen from the graph.
(iii) The velocity of the body at any instant of time can be determined.
(iv) By simply looking at the graph, one can tell whether motion is uniform or not.
(v) Slope of velocity-time graph gives the acceleration of the body.
(vi) Graphs are very useful for comparing the motions of two moving bodies. Distance-time graphs easily tell when and where one body crosses the other body.
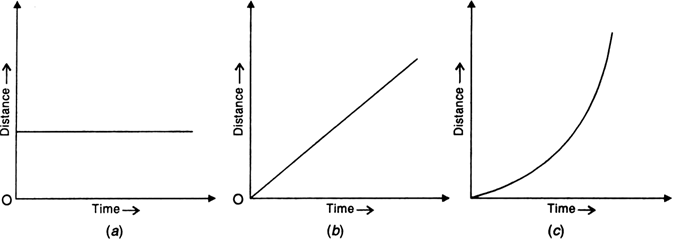
What is distance-time graph of a body? Draw distance-time graphs for,
(i) a stationary body,
(ii) a body moving with uniform velocity, and
(iii) a body moving with variable velocity.
Distance-time graph. It is a graph obtained by plotting distance travelled along Y-axis and time taken along X-axis.
(i) Distance-time graph for stationary body. The position of a stationary body does not change with time. So distance-time graph for a stationary body is a straight line parallel to time axis, as shown in Fig. 8.7 (a).
(ii) Distance-time graph for uniform velocity. For a body moving with uniform velocity, the distance travelled is proportional to the time taken. So distance-time graph is a straight line inclined to the time axis, as shown in Fig. 8.7 (b).
(iii) Distance-time graph for variable velocity. When a body moves with variable velocity, it covers unequal distances in equal intervals of time. So the distance-time graph is not a straight line but it is a curve, as shown in Fig. 8.7 (c).
What is velocity-time graph of a body? Draw velocity-time graphs for
(i) a body moving with uniform velocity,
(ii) a body moving with uniform acceleration, and
(iii) a body moving with variable acceleration.
Velocity-time graph. It is the graph obtained by plotting velocity of the body along Y-axis and time along X-axis.
(i) Velocity-time graph for uniform velocity. For a body moving with a constant velocity, the velocity-time graph is a straight line parallel to the time-axis, as shown in Fig. (a).
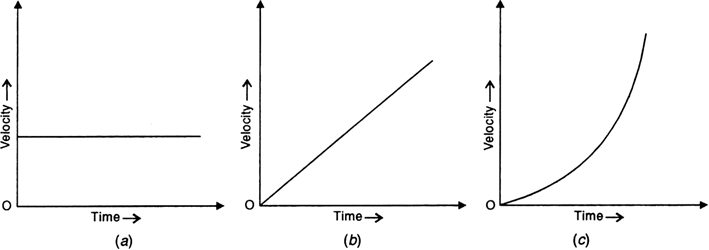
(ii) Velocity-time graph for uniform acceleration. For a body in uniform acceleration, the increase in velocity is proportional to the time taken. So velocity-time graph is a straight line inclined to the time-axis, as shown in Fig. (b).
(iii) Velocity-time graph for variable acceleration. For a body having variable acceleration, the velocity increases by unequal amounts in equal intervals of time. So velocity-time graph is a curve, as shown in Fig. (c).


 Switch


